mirror of
https://github.com/klinecharts/KLineChart.git
synced 2024-11-25 16:22:43 +08:00
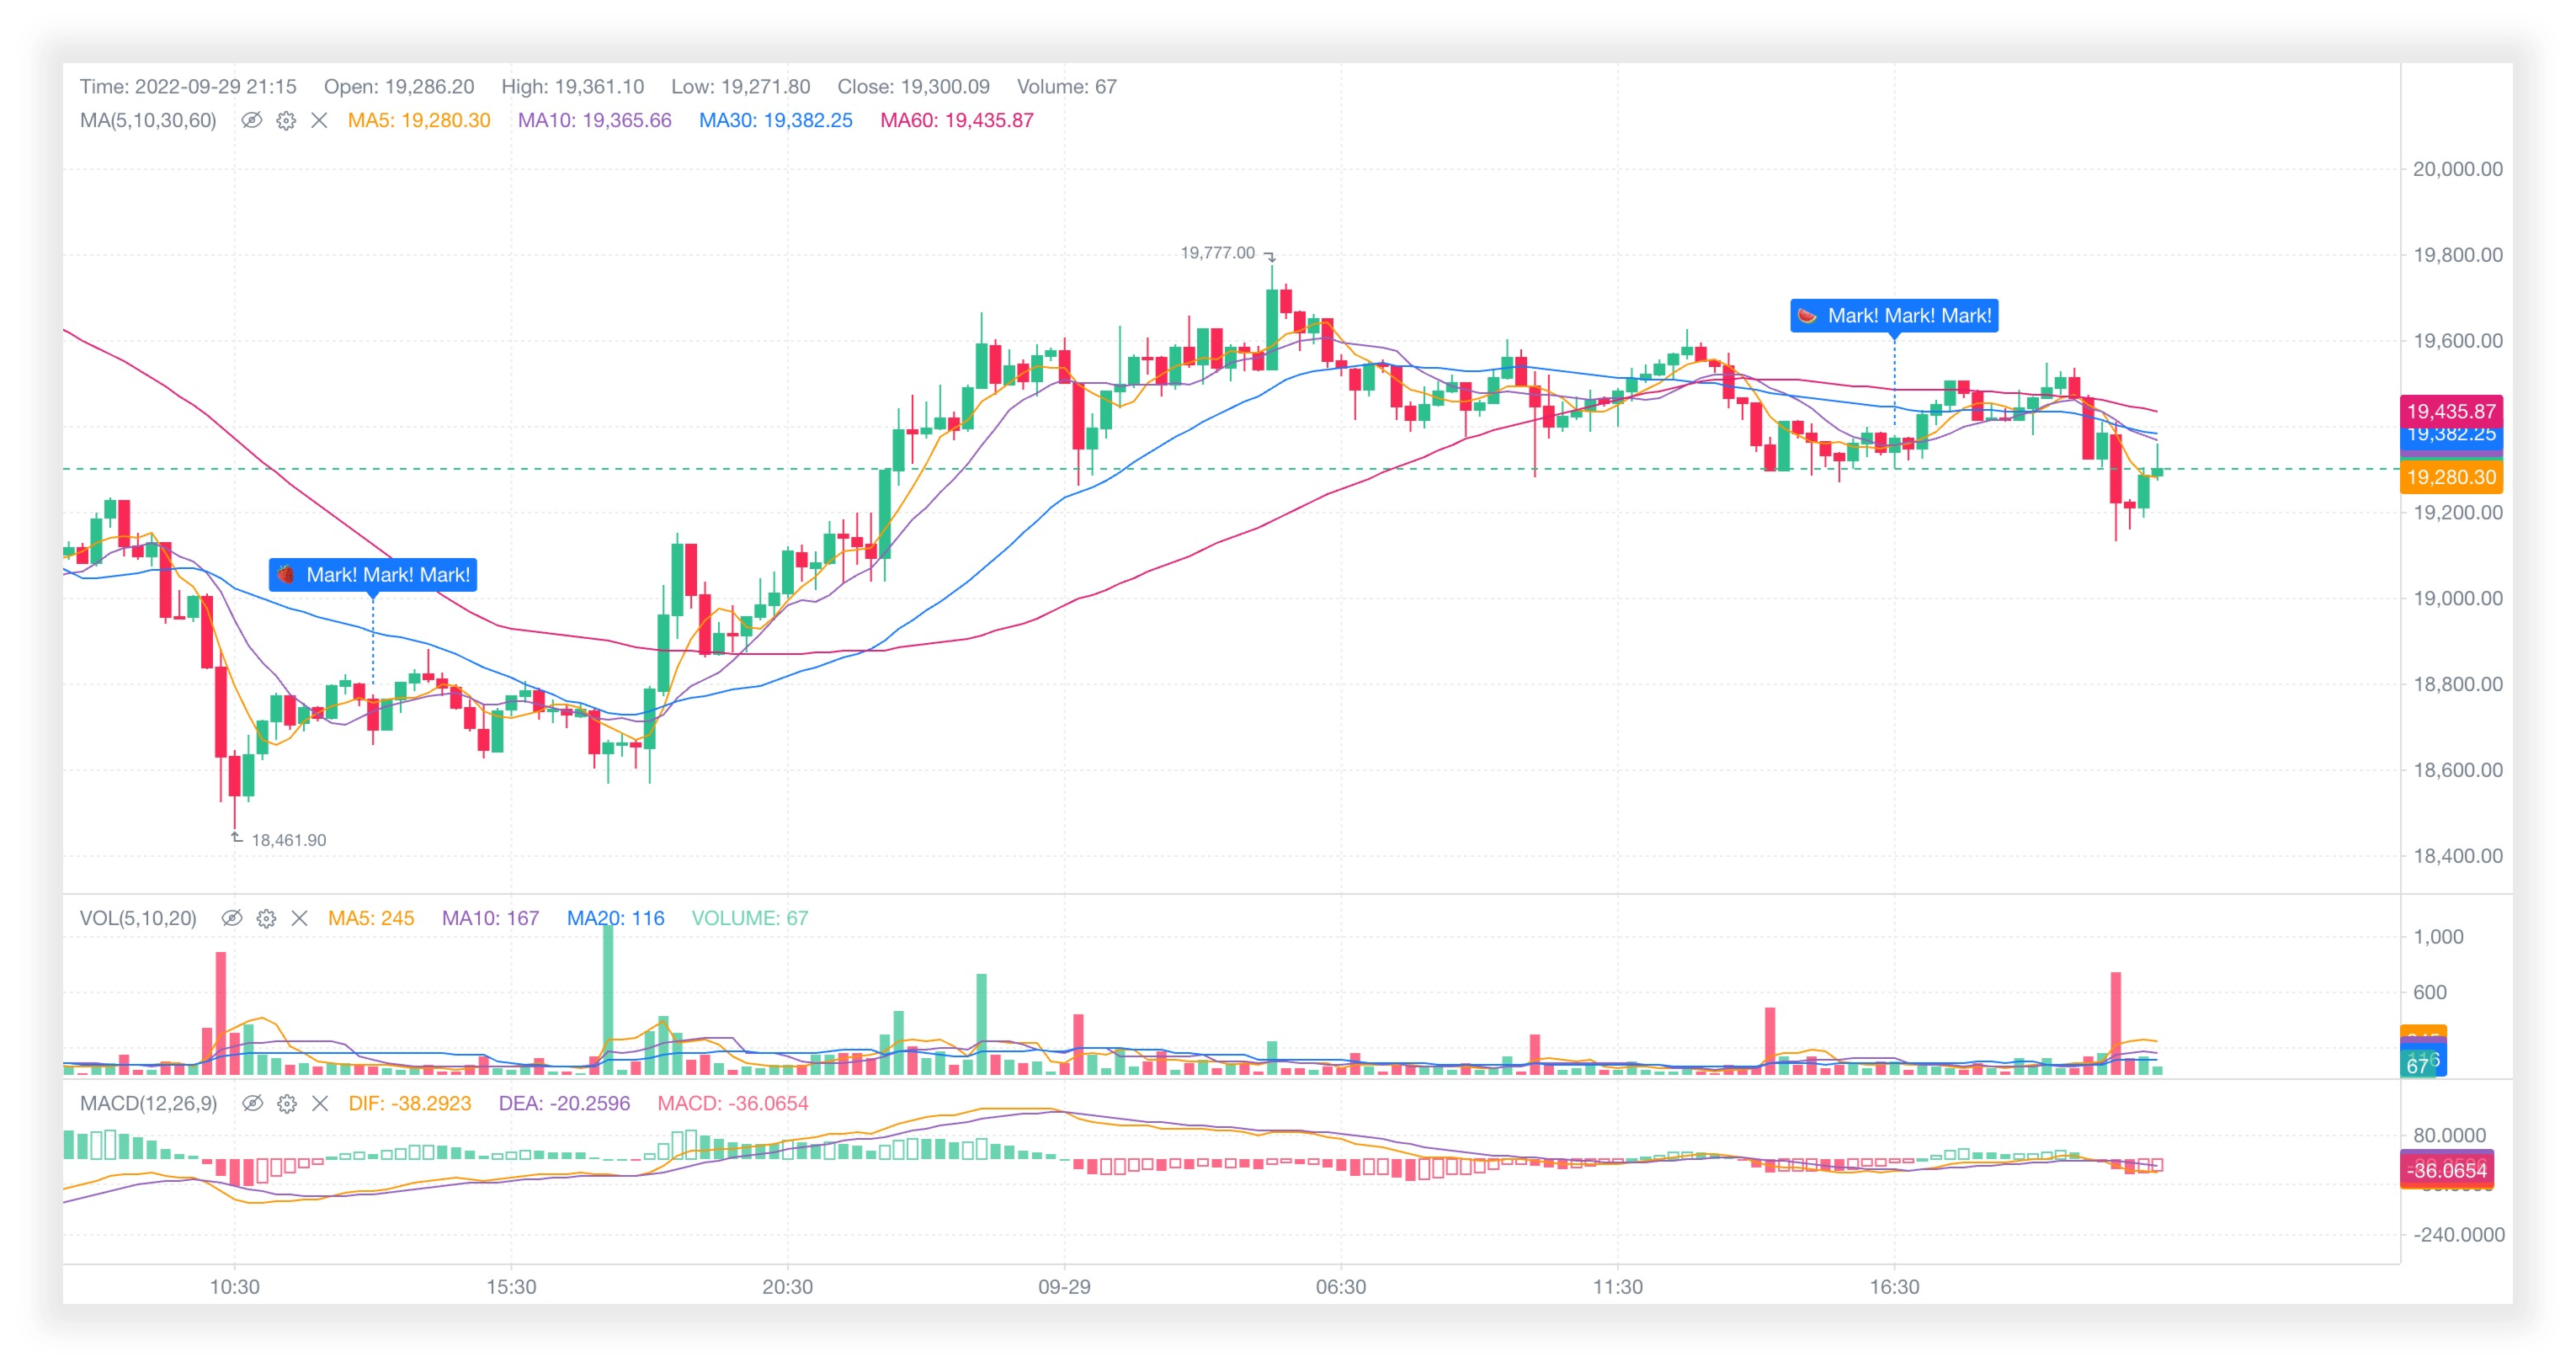
📈Lightweight k-line chart that can be highly customized. Zero dependencies. Support mobile.(可高度自定义的轻量级k线图,无第三方依赖,支持移动端)
| .github | ||
| .husky | ||
| docs | ||
| licenses | ||
| scripts | ||
| src | ||
| tests | ||
| .editorconfig | ||
| .eslintignore | ||
| .eslintrc.cjs | ||
| .gitignore | ||
| CONTRIBUTING.md | ||
| index.js | ||
| LICENSE | ||
| logo.svg | ||
| NOTICE | ||
| package.json | ||
| README.md | ||
| README.zh-CN.md | ||
| tsconfig.json | ||
KLineChart
English | 简体中文
💹📈 Lightweight k-line chart built with html5 canvas.

✨ Features
- 📦 Out of the box: Simple and fast integration, basically zero cost to get started.
- 🚀 Lightweight and smooth: Zero dependencies, only 40k under gzip compression.
- 💪 Powerful functions: Built-in multiple indicators and line drawing models.
- 🎨 Highly scalable: With rich style configuration and API, the function can be extended as you like.
- 📱 Mobile: Support mobile, one chart, handle multiple terminals.
- 🛡 Typescript development: Provide complete type definition files.
⚡ Performance
Similar to chart libraries for performance comparison.
- Test Scenario: 50000 pieces of data, 5 pane indicators, average 10 runs
- Device: macOS Ventura, Apple M2 Pro, 16G
- Browser: Chrome 114.0.5735.106
- Framework: React@18.2.0
Comparison of time consumption from initialization to full rendering:
| klinecharts@9.4.0 | night-vision@0.3.2 | hqchart@1.1.12147 |
|---|---|---|
| 37ms | 36ms | 241ms |
📦 Install
Using npm
npm install klinecharts --save
Using yarn
yarn add klinecharts
CDNs
unpkg
<script type="text/javascript" src="https://unpkg.com/klinecharts/dist/klinecharts.min.js"></script>
jsDelivr
<script type="text/javascript" src="https://cdn.jsdelivr.net/npm/klinecharts/dist/klinecharts.min.js"></script>
📄 Docs
Online
Locale
Execute command in root directory. Node.js is required.
# Install the dependencies
npm install

# Start document service
npm run docs:dev
After successful startup, open in the browser http://localhost:8888 .
🛠️ Build
Execute command in root directory. Node.js is required.
# Install the dependencies
npm install

# Build files
npm run build
The generated files are in the dist folder.
🔗 Links
©️ License
KLineChart is available under the Apache License V2.


